Essay
The trend line and seasonal indexes shown below were computed from four weeks of daily observations.Forecast the seven values for the next week.
Trend Line:  = 145 + 1.66t (t = 1,2,3,...28)
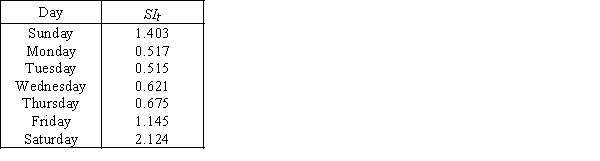
Correct Answer:

Verified
Correct Answer:
Verified
Related Questions
Q63: Given a data set with 15 yearly
Q118: Motor Oil Sales <br>As part of
Q119: Holiday Hours<br> The total holiday hours (in
Q120: Liquor Sales<br> The number of cases of
Q121: Mattress Sales <br>Monthly mattress sales (in
Q124: The most commonly used measures of forecast
Q125: Motor Oil Sales <br>As part of
Q126: If there is no obvious trend or
Q127: Which method would you recommend to your
Q128: Daily Sandwich Sales <br>The daily sales figures