Essay
Regression analysis with t = 1 to 80 was used to develop the following forecast equation:  = 250 + 7.8t + 1.4Q1− 1.7Q2− 1.4Q3,where
 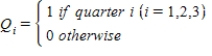 Forecast the next four values.
Correct Answer:

Verified
Correct Answer:
Verified
Related Questions
Q18: Which of the following methods is appropriate
Q19: The following is the list of mean
Q20: Liquor Sales<br> The number of cases of
Q21: To create a seasonally adjusted time series,divide
Q22: The mean absolute deviation (MAD)and the sum
Q24: The term "seasonal variation" may refer to:<br>A)systematic
Q25: ebay Storefront Sales <br>The sales figures (in
Q26: The mean absolute deviation averages the absolute
Q27: Which of the following is not true
Q28: Photo Equipment Store Earnings<br> The quarterly