Essay
The trend line  = 1800 + 75t− 2t2 and seasonal indexes shown in the table below were computed from five years of quarterly observations.Forecast the four quarterly values for next year.
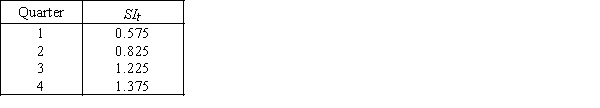
Correct Answer:

Verified
Correct Answer:
Verified
Related Questions
Q212: Smoothing time series data by the moving
Q213: Mattress Sales <br>Monthly mattress sales (in
Q214: The term "seasonal variation" may refer to
Q215: Which of the following will be reflected
Q216: The trend line <img src="https://d2lvgg3v3hfg70.cloudfront.net/TB4388/.jpg" alt="The trend
Q218: ebay Storefront Sales <br>The sales figures (in
Q219: In time series regressions the random variation
Q220: The linear model for long-term trend is:
Q221: Which of the following will not be
Q222: Random variation is one of the four