Essay
A time series is shown in the table below: 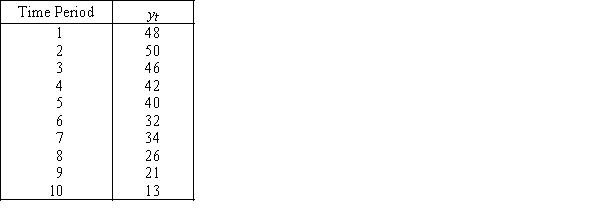
a.Plot the time series to determine which of the trend models appears to fit better.
b.Use the regression technique to calculate the linear trend line and the quadratic trend line.Which line fits better? Use the best model to forecast the value of y for time period 7.
Correct Answer:

Verified
a. The linear trend model appears to be ...View Answer
Unlock this answer now
Get Access to more Verified Answers free of charge
Correct Answer:
Verified
View Answer
Unlock this answer now
Get Access to more Verified Answers free of charge
Q100: The model y<sub>t</sub> = T<sub>t</sub> + C<sub>t</sub>
Q101: The trend line <img src="https://d2lvgg3v3hfg70.cloudfront.net/TB4388/.jpg" alt="The trend
Q102: We calculate the three-period moving averages for
Q103: The trend line <img src="https://d2lvgg3v3hfg70.cloudfront.net/TB4388/.jpg" alt="The trend
Q104: The trend equation for quarter sales data
Q106: Based on the following scatter plot,which of
Q107: If summer 2011 sales were $16,800 and
Q108: Liquor Sales<br> The number of cases of
Q109: The high level of airline ticket sales
Q110: Microprocessors <br>Annual production (in millions)of computer microprocessors