Essay
A time series for the years 1996-2001 is shown below. 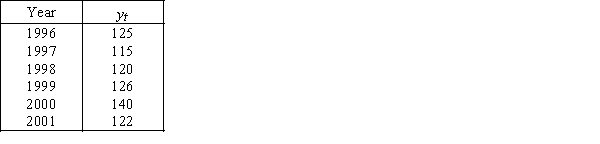 The forecasts for the years 2002-2004 with three smoothing constant values are:
With w = .2,F2002 = F2003 = F2004 = 125.60
With w = .5,F2002 = F2003 = F2004 = 126.75
With w = .6,F2002 = F2003 = F2004 = 126.55
Compare each of the three sets of forecasts with the actual values for 2002-2004 given in the accompanying table,and compute the mean absolute deviation (MAD)for each model.Which model is best? 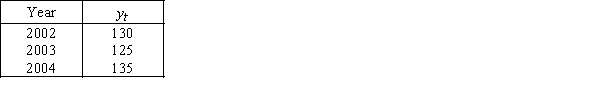
Correct Answer:

Verified
 With w = 0.2,MAD = 4.80.With ...
View Answer
Unlock this answer now
Get Access to more Verified Answers free of charge
Correct Answer:
Verified
View Answer
Unlock this answer now
Get Access to more Verified Answers free of charge
Q137: After estimating a trend model for annual
Q138: We compute the five-period moving averages for
Q139: A time series for the years 2011-2016
Q140: Hotel Occupancy<br>A small hotel has recorded the
Q141: The fairly regular fluctuations that occur within
Q143: Seasonal variation is one of the four
Q144: Motor Oil Sales <br>As part of
Q145: Smoothing time series data by the moving
Q146: The seasonal variation,one of the four different
Q147: If data for a time series analysis