Essay
25 Samples Production
25 samples of size 4 were taken from a manufacturing process.The mean of the sample means and the pooled standard deviation are  ,and S = 3.5,respectively.The sample means are listed below.
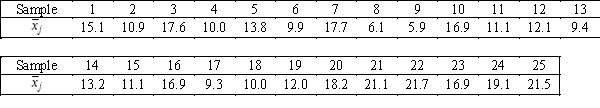
-{25 Samples Production Narrative} Find the centerline and control limits for the  chart.
Correct Answer:

Verified
Correct Answer:
Verified
Q104: The mean of the sample means and
Q105: Control charts used to determine if the
Q106: 20 samples of size 1,500 were drawn
Q107: 50 samples of size 2,000 were taken
Q108: Suppose previously your company decided that a
Q110: To construct a p chart,draw samples of
Q111: We construct a p chart to track
Q112: Which of the following is an example
Q113: A process capability index (C<sub>p</sub>)of 2.0 describes
Q114: The p chart is an example of