Essay
30 Samples Production Thirty samples of size 4 were drawn from a production process.The data are shown below. 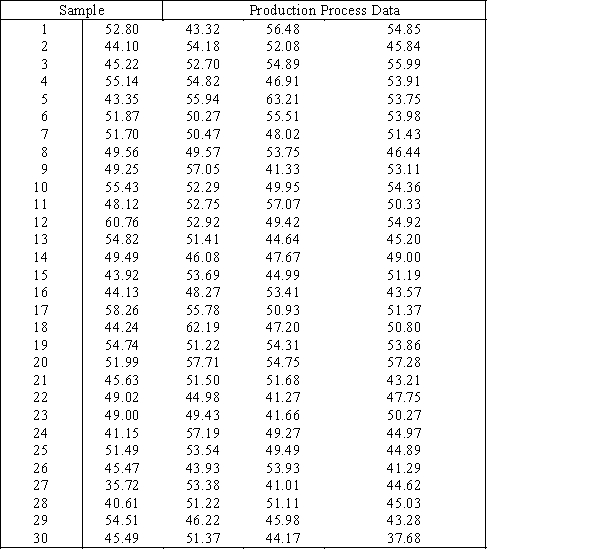
-{30 Samples Production Narrative} Looking at the  and S charts developed in a previous question,can you infer that the process is under control? If so,explain why.If not,explain what the problems are.
Correct Answer:

Verified
We cannot infer that the process is in c...View Answer
Unlock this answer now
Get Access to more Verified Answers free of charge
Correct Answer:
Verified
View Answer
Unlock this answer now
Get Access to more Verified Answers free of charge
Q2: _ variation is caused by specific events
Q3: Control charts that are used to monitor
Q4: The <img src="https://d2lvgg3v3hfg70.cloudfront.net/TB4388/.jpg" alt="The chart
Q5: What is the average run length (ARL)until
Q6: 40 Samples Manufacturing <br>The mean of
Q8: Diaper Delivery <br>Wrap-M-Up,a Ft.Lauderdale diaper Service,has 10
Q9: If the average run length of a
Q10: Assume that the control limits of an
Q11: In statistical process control,a Type II error
Q12: If a machine part is slowly losing