Essay
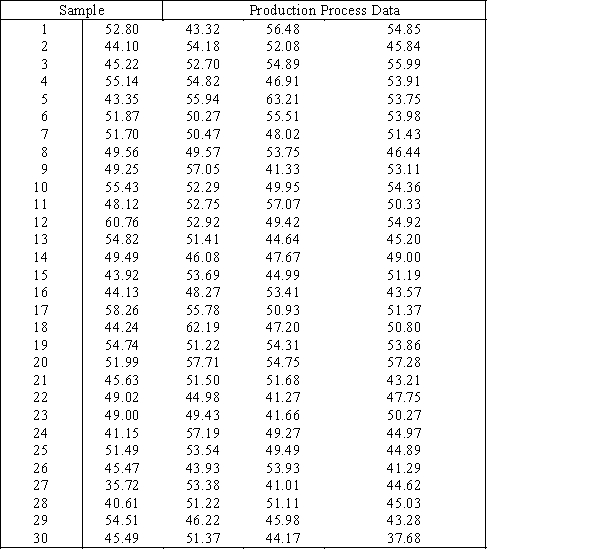
30 Samples Production Thirty samples of size 4 were drawn from a production process.The data are shown below. 
-{30 Samples Production Narrative} Looking at the  chart developed in a previous question,you see indications of a possible level shift as well as cyclic variation.Explain how the chart shows this,and give a possible explanation.
Correct Answer:

Verified
Most of the points lie above the centerl...View Answer
Unlock this answer now
Get Access to more Verified Answers free of charge
Correct Answer:
Verified
View Answer
Unlock this answer now
Get Access to more Verified Answers free of charge
Q84: 40 Samples Manufacturing <br>The mean of
Q85: 40 samples of size 800 were drawn
Q86: Assembly Line<br> Random samples of 200 parts
Q87: When no point lies outside the control
Q88: A predictable change in operators for the
Q90: A hypothesis test is used to determine
Q91: To determine whether the distribution mean of
Q92: Variations in a process that are caused
Q93: In order to ensure that a manufacturing
Q94: If you change the control limits from