Essay
Assembly Line
Random samples of 200 parts were taken on an assembly line every hour for the past 25 hours.The number of defective parts is shown in the accompanying table. 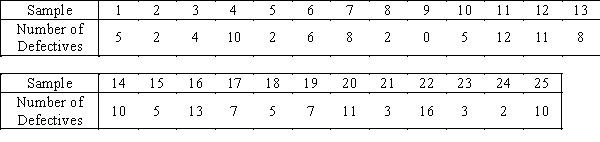
-{Assembly Line Narrative} Calculate the centerline and control limits for the p chart.
Correct Answer:

Verified
 (since the LCL i...
View Answer
Unlock this answer now
Get Access to more Verified Answers free of charge
Correct Answer:
Verified
View Answer
Unlock this answer now
Get Access to more Verified Answers free of charge
Q45: The mean of the sample means and
Q46: The process capability index measures the capability
Q47: The letter p in p chart stands
Q48: In statistical process control,a Type I error
Q49: Fifty samples of size 1,000 were drawn
Q51: If a p control chart finds six
Q52: When the <img src="https://d2lvgg3v3hfg70.cloudfront.net/TB4388/.jpg" alt="When the
Q53: A level shift is a change in
Q54: _ variation is caused by a number
Q55: To determine whether the process distribution standard