Multiple Choice
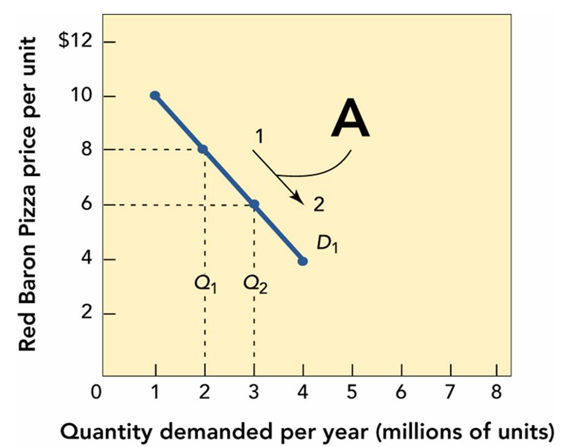
-Figure 11-3A above shows that when the price for Red Baron frozen cheese pizzas moves from $8 to $6 per unit along the demand curve D1, the quantity demanded
A) increases from 2 to 3 million units per year.
B) decreases from 3 to 2 million units per year.
C) stays the same.
D) increases from 6 to 8 million units per year.
E) decreases from 8 to 6 million units per year.
Correct Answer:

Verified
Correct Answer:
Verified
Q55: A company that manages apartments decides to
Q58: A penetration pricing policy is most likely
Q65: Predatory pricing refers to<br>A)the practice of charging
Q129: The key to setting a final price
Q167: Describe a profit objective used by many
Q176: Bundle pricing is considered to be a
Q185: What is the difference between a one-price
Q189: The newer a product and the earlier
Q223: Some specialty-toy retailers pursue a _ pricing
Q265: Which of the following is a demand-oriented