Multiple Choice
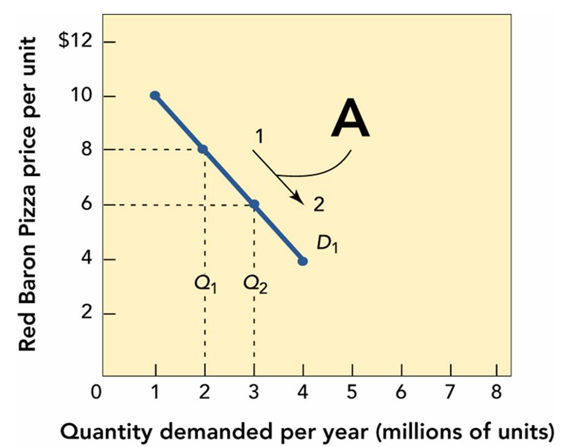
-Figure 11-3A above shows that when the quantity demanded for Red Baron frozen cheese pizzas moves from 2 to 3 million units along the demand curve D1, the profit
A) increases from $6 to $8 per unit.
B) decreases from $8 to $6 per unit.
C) stays the same per unit.
D) increases from $2 to $3 per unit.
E) impacts cannot be determined.
Correct Answer:

Verified
Correct Answer:
Verified
Q20: Total revenue refers to<br>A)the profit made from
Q49: Explain why odd-even pricing may be successful.
Q212: When Dell sells various laptops,it also pre-installs
Q223: In the early 1980s, typical round-trip coach
Q254: The practice of charging different prices to
Q311: Consumers buy water and soda from vending
Q315: What is critical when using target profit
Q319: <img src="https://d2lvgg3v3hfg70.cloudfront.net/TB2497/.jpg" alt=" -In
Q320: Mike Morgan, a sales representative for a
Q321: When estimating demand, price is not the