Multiple Choice
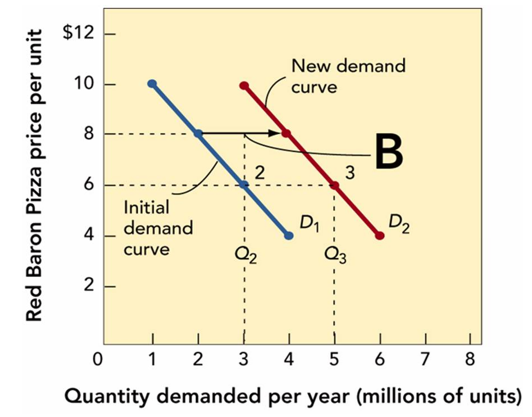
-Figure 11-3B above shows that when the quantity demanded for Red Baron frozen cheese pizzas moves from 2 to 3 million units from the demand curve D1 to the demand curve D2, the profit
A) Figure 11-3B does not indicate what happens to profit when the quantity demanded changes.
B) increases from $2 to $3 per unit.
C) stays the same per unit.
D) increases from $6 to $8 per unit.
E) decreases from $8 to $6 per unit.
Correct Answer:

Verified
Correct Answer:
Verified
Q31: Which of these is true about a
Q37: A graphic presentation of the break-even analysis
Q38: Which of the following is a form
Q40: Price discrimination refers to<br>A)the practice of charging
Q123: Describe the pricing constraints a firm is
Q169: A manufacturer using _ is setting a
Q213: Which of the following is a cost-oriented
Q223: A firm's profit equation demonstrates that profit
Q257: Which of the following pricing techniques results
Q353: Identifying pricing objectives and constraints would occur