Multiple Choice
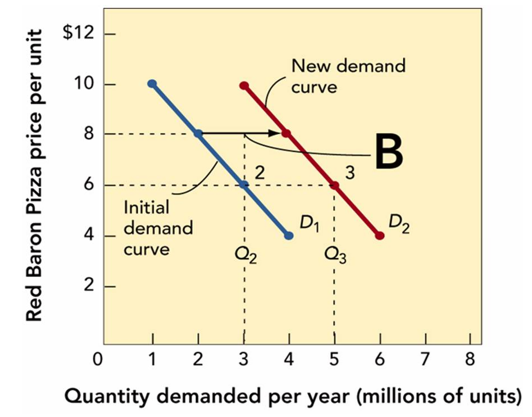
-In Figure 11-3B above, the demand curve shifts from D1 to D2. This most likely represents
A) an increase in demand that did not require a change in price but was the result of a change in one or more demand factors.
B) an increase in demand that required a decrease in price.
C) no change in price and a decrease in demand that results from internal business practice changes.
D) no change in demand or price but a greater profit due to economies of scale.
E) an decrease in price from $8 to $6 per unit.
Correct Answer:

Verified
Correct Answer:
Verified
Q10: Basic to setting a product's price is
Q33: Which of the following is an example
Q50: Distinguish between elastic demand and inelastic demand.
Q87: In response to Duracell's introduction of the
Q200: Marketing managers often use break-even analysis to
Q203: Each month, the owner of a car
Q218: Which of the following is a typical
Q257: What are the three major steps involved
Q292: What are two special adjustments to the
Q388: Target return-on-sales pricing refers to<br>A)adjusting the price