Multiple Choice
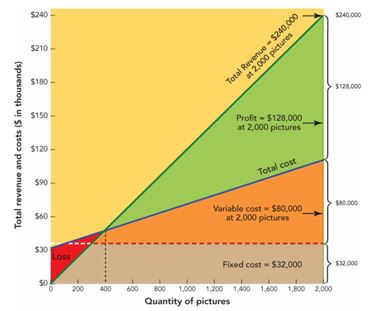
-Figure 11-6 above depicts a __________.
A) Gantt chart
B) demand curve
C) break-even chart
D) ROI analysis
E) cross-tabulation
Correct Answer:

Verified
Correct Answer:
Verified
Related Questions
Q50: Distinguish between elastic demand and inelastic demand.
Q87: In response to Duracell's introduction of the
Q203: Each month, the owner of a car
Q205: All of the following are examples of
Q292: What are two special adjustments to the
Q381: <span class="ql-formula" data-value="\begin{array} { | l c
Q382: Price fixing refers to<br>A)an arrangement a manufacturer
Q384: Which one of the following statements regarding
Q385: <img src="https://d2lvgg3v3hfg70.cloudfront.net/TB2497/.jpg" alt=" -A shift of
Q388: Target return-on-sales pricing refers to<br>A)adjusting the price