Multiple Choice
Flexible Pricing Chart
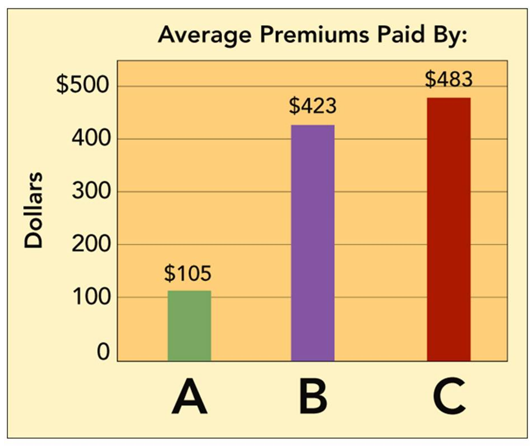
-Consider the flexible pricing chart above, which shows the results of a National Bureau of Economic Research study of 750,000 car purchases. The data indicate that some groups of car buyers, on average, paid roughly $105, $423, and $483 respectively for a new car in the $21,000 range than the typical purchaser. Who are the car buyers in column A?
A) women
B) the elderly
C) Hispanics
D) African Americans
E) Asian Americans
Correct Answer:

Verified
Correct Answer:
Verified
Q20: Total revenue refers to<br>A)the profit made from
Q49: Explain why odd-even pricing may be successful.
Q128: All of the following are synonyms for
Q160: Barter refers to<br>A)a reciprocity agreement stipulating that
Q212: When Dell sells various laptops,it also pre-installs
Q216: Explain the price equation in the context
Q243: What is the difference between and EDLP
Q304: The price-setting process includes identifying pricing objectives
Q305: The quantity at which total revenue and
Q311: Consumers buy water and soda from vending