Multiple Choice
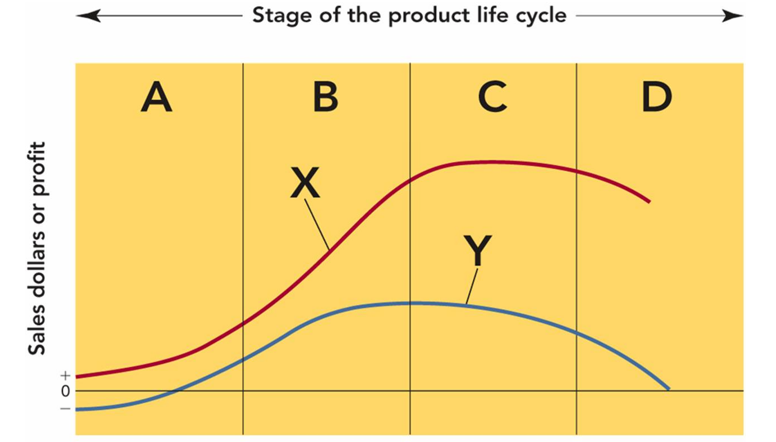
-Figure 10-1 above represents the stages of the product life cycle. What does the portion of the curve labeled C represent?
A) introduction
B) maturity
C) growth
D) accelerated development
E) decline
Correct Answer:

Verified
Correct Answer:
Verified
Q17: When consumers think of Harley-Davidson, the image
Q26: Sales exhibit a steady downward trend throughout
Q63: Many nonprofit organizations use PSAs in their
Q84: An expanded marketing mix for services that
Q87: Brand equity is the added value a
Q128: <img src="https://d2lvgg3v3hfg70.cloudfront.net/TB8552/.jpg" alt=" CDI/BDI Marketing Dashboard
Q130: Reducing the package content without changing package
Q205: An organization's use of a name, phrase,
Q228: Adding value to the product (or line)
Q230: Which of the following statements regarding the