Multiple Choice
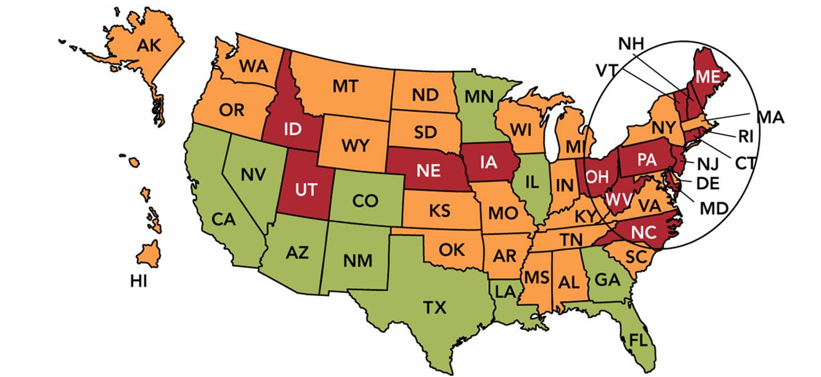
-In the UMD9: Marketing Dashboard Map above, the annual growth rate in each state is shown, with green (which looks gray on printed paper) meaning good and red (which looks black on printed paper) meaning very poor. If you were a marketing manager faced with this dashboard, which of the following would be the best action?
A) Focus on the shortfalls in Idaho (ID) and Utah (UT) .
B) Revise the relevant goals for both east and west coast.
C) Conduct additional market research in the southern United States.
D) Examine your distribution system in the northeastern United States.
E) Change the marketing metric being used to evaluate the states individually.
Correct Answer:

Verified
Correct Answer:
Verified
Q68: New-product or service failures may be reduced
Q70: Which of the following would most likely
Q103: Which of the following is the best
Q179: What does it mean when we say
Q235: Compare continuous, dynamically continuous, and discontinuous innovations.
Q266: A good has tangible attributes that a
Q291: Unsought products are<br>A)any products associated with impulse
Q292: Consumer products refer to<br>A)products used in the
Q293: Consumer product classifications differ in terms of
Q294: Prego recently introduced a Pasta Bake Sauce,