Multiple Choice
Refer to the accompanying diagram to answer the following questions :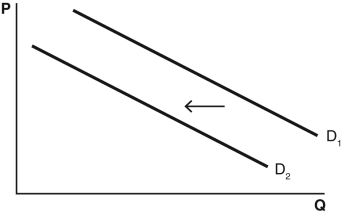
-The demand curve shift shown in the figure was caused by a(n)
A) increase in the input cost of the good.
B) increase in the price of a substitute of the good.
C) decrease in the number of firms selling the good.
D) decrease in the number of buyers in the market for the good.
E) expectation that the future price of this good will be higher than it is currently.
Correct Answer:

Verified
Correct Answer:
Verified
Q23: What would happen to the equilibrium price
Q24: There is a competitive market for dog
Q25: Wine and cheese are complement goods because
Q26: Refer to the accompanying diagram to answer
Q27: After Sushmita lost her job,she found that
Q29: In 1985,International Data Corp.(IDC)estimated that 3.7 million
Q30: When supply shifts left and demand shifts
Q31: Which of the following would cause a
Q32: You are given the following demand schedule:<br><img
Q33: During the hot summer months,more people want