Multiple Choice
The change in equilibrium shown in the accompanying figure would be explained by a(n) ________ in the price of an input and a(n) ________ in the price of a ________. 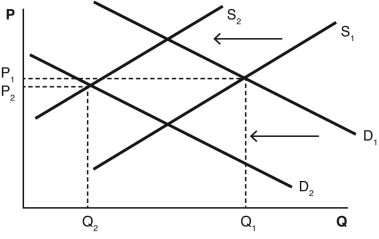
A) increase; increase; complement
B) decrease; increase; complement
C) decrease; increase; substitute
D) increase; decrease; complement
E) increase; increase; substitute
Correct Answer:

Verified
Correct Answer:
Verified
Q156: Assume that the market for cheeseburgers consists
Q157: Refer to the following figure to answer
Q158: If the number of buyers in a
Q159: In agriculture,a "bumper crop" refers to a
Q160: If the price of rubber were to
Q162: Answer the following questions about a market
Q163: Refer to the accompanying diagram.Which of the
Q164: As electric cars have become more acceptable
Q165: If the price and quantity for an
Q166: According to a supply and demand model