Multiple Choice
Refer to the following graphs to answer the following questions.
A. 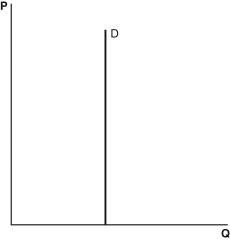 B.
B. 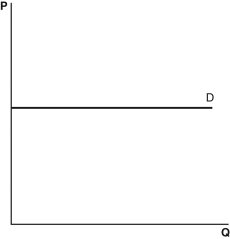 C.
C. 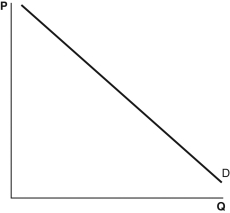 D.
D. 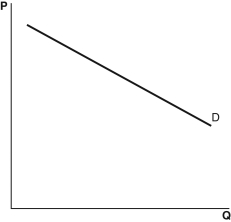 E.
E. 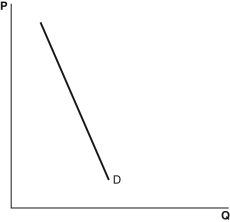
-Which of these graphs most likely depicts a price elasticity of demand of -0.2?
A) Graph A
B) Graph B
C) Graph C
D) Graph D
E) Graph E
Correct Answer:

Verified
Correct Answer:
Verified
Related Questions
Q75: Toyota uses a just-in-time production method to
Q76: If the percentage change in the quantity
Q77: When the quantity demanded is less sensitive
Q78: How can a firm increase total revenue?<br>A)
Q79: When would oil producers see the largest
Q81: Assume that the demand for Choco Candy
Q82: A firm knows that the price elasticity
Q83: A firm knows that Seneca's income elasticity
Q84: When the price of a basketball is
Q85: A professional hockey arena has a maximum