Multiple Choice
Use the following graph to answer the following questions.
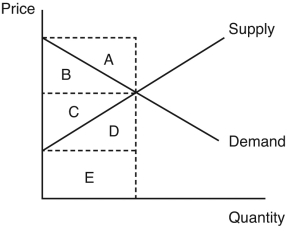
-In the figure,which area represents the producer surplus?
A) area A
B) area B
C) area C
D) area D
E) area E
Correct Answer:

Verified
Correct Answer:
Verified
Related Questions
Q145: If the government wants to raise taxes
Q146: Social welfare (i.e. ,the sum of producer
Q147: The demand for food is very inelastic,making
Q148: When a good with a perfectly inelastic
Q149: Explain the difference between efficiency and equity.Which
Q151: The per-unit dollar amount of a tax
Q152: How successful would a $1 excise tax
Q153: The incidence of a tax reflects<br>A) who
Q154: Why is deadweight loss greater when goods
Q155: Compared to consumers,producers will lose the lesser