Multiple Choice
Use the following information to answer the following questions.
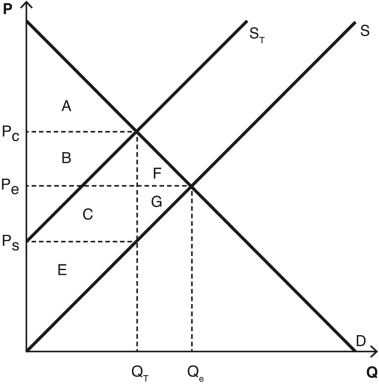
The following graph depicts a market where a tax has been imposed.Pe was the equilibrium price before the tax was imposed,and Qe was the equilibrium quantity.After the tax,PC is the price that consumers pay,and PS is the price that producers receive.QT units are sold after the tax is imposed.NOTE: The areas B and C are rectangles that are divided by the supply curve ST.Include both sections of those rectangles when choosing your answers.

-Which areas represent producer surplus after the tax is imposed?
A) E + C + G
B) E + C
C) E + G
D) F + G
E) E
Correct Answer:

Verified
Correct Answer:
Verified
Q3: The revenue generated from a tax equals
Q4: A tax on apples would cause consumers
Q5: When looking at a supply and demand
Q6: A tax on consumers would cause the
Q7: Deadweight loss is defined as<br>A) the cost
Q9: Use the following information to answer the
Q10: A tax on milk would likely cause
Q11: A(n)_ in the elasticity of supply or
Q12: The incidence of a tax is unrelated
Q13: In the long run,both supply and demand