Multiple Choice
Use the following information to answer the following questions.
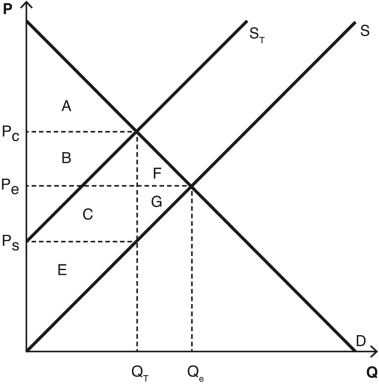
The following graph depicts a market where a tax has been imposed.Pe was the equilibrium price before the tax was imposed,and Qe was the equilibrium quantity.After the tax,PC is the price that consumers pay,and PS is the price that producers receive.QT units are sold after the tax is imposed.NOTE: The areas B and C are rectangles that are divided by the supply curve ST.Include both sections of those rectangles when choosing your answers.

-Which areas represent the total tax revenue created as a result of the tax?
A) A + C
B) A + E
C) B + C
D) A + E + F + G
E) A + B + C + D + E + F + G
Correct Answer:

Verified
Correct Answer:
Verified
Q69: In a market where supply and demand
Q70: When looking at a supply and demand
Q71: The luxury tax of 1990 produced far
Q72: In a market where supply and demand
Q73: When supply is perfectly inelastic,the supply curve
Q75: Consumers will lose no consumer surplus due
Q76: Compared to producers,consumers will lose the lesser
Q77: The price-quantity combination found where the supply
Q78: When supply is perfectly elastic,the supply curve
Q79: Taxes will almost always cause consumer prices