Multiple Choice
Use the following information to answer the following questions.
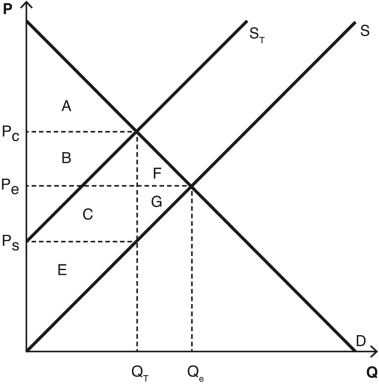
The following graph depicts a market where a tax has been imposed.Pe was the equilibrium price before the tax was imposed,and Qe was the equilibrium quantity.After the tax,PC is the price that consumers pay,and PS is the price that producers receive.QT units are sold after the tax is imposed.NOTE: The areas B and C are rectangles that are divided by the supply curve ST.Include both sections of those rectangles when choosing your answers.

-Which areas represent the deadweight loss created as a result of the tax?
A) A + B + C + E + F + G
B) A + C
C) A + B + C + E
D) F + G
E) B + C + F + G
Correct Answer:

Verified
Correct Answer:
Verified
Q112: When a tax is imposed on some
Q113: The deadweight loss from a tax is
Q114: When a tax is imposed on some
Q115: Social welfare is measured as the sum
Q116: When a tax is imposed on some
Q118: Consumer surplus is the difference between<br>A) supply
Q119: All else held constant,a decrease in the
Q120: How would frequent consumer irrationality prevent a
Q121: When demand is perfectly inelastic,the demand curve
Q122: Use a figure with intersecting supply and