Multiple Choice
Refer to the following graphs to answer the following questions:
A. 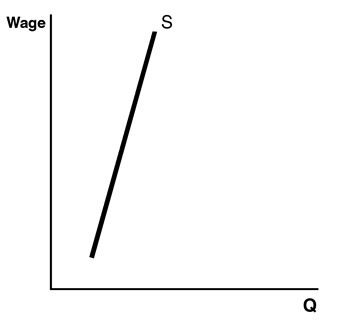
B.11efbc7a_aae2_b1ce_a154_5b2bc6d63cd5_TB4871_00
C. 11efbc7b_3472_260f_a154_33be1c4f264b_TB4871_00
D.11efbc7b_3e43_4570_a154_e989ac5b41ce_TB4871_00
E.11efbc7b_469c_1cb1_a154_3fa9426f32a6_TB4871_00
-Which graph shows a person who has a fixed quantity of hours that he or she is willing to work per week?
A) Graph A
B) Graph B
C) Graph C
D) Graph D
E) Graph E
Correct Answer:

Verified
Correct Answer:
Verified
Q100: Use the following table,which shows the supply
Q101: Where would economic rents be highest?<br>A) Cincinnati,Ohio<br>B)
Q102: The citizens of Robbinsville notice that their
Q103: Outsourcing has been a controversial topic ever
Q104: How does diminishing marginal product affect the
Q106: The worker productivity of Cutie Cupcakes is
Q107: With a large group of citizens leaving
Q108: A situation with only one buyer of
Q109: Because a product's demand for an input
Q110: In theory,some people might lose in the