Essay
Figure:
Read the following research report and answer the questions that follow.
A researcher compares men's and women's attitudes toward dating their best friend's former girl/boy friend.Specifically,college students are asked to read a story describing a situation in which their best friend breaks up with a partner and they later have an opportunity to date their best friend's former partner.Men and women rate the likelihood they would choose to date their best friend's former partner using a 10-point scale (0 = not at all likely and 9 = completely likely).In addition,participants rate the extent to which a similar situation has occurred to them using a 10-point scale (0 = not at all and 9 = completely).The results of this study are presented below: 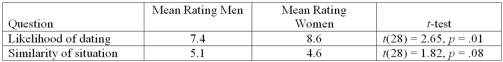
-How many men and women were there in this study (assuming equal numbers of men and women)?
Correct Answer:

Verified
We know there were 3...View Answer
Unlock this answer now
Get Access to more Verified Answers free of charge
Correct Answer:
Verified
View Answer
Unlock this answer now
Get Access to more Verified Answers free of charge
Q5: Explain the difference between experimental sensitivity and
Q21: = 7.30,p = .01.On the basis of
Q25: The primary way that analysis of variance
Q26: Figure:<br>Read the following research report and answer
Q27: In general,a repeated measures design is likely
Q29: If the omnibus analysis of variance for
Q31: The expected value of the F-statistic when
Q32: Figure:<br>Use the ANOVA Summary Table to answer
Q35: A result that is not "statistically significant"
Q43: Results that are "statistically significant" may not