Multiple Choice
The following diagram represents the reaction of A2 (unshaded spheres) with B2 (shaded spheres) .How many moles of product can be produced from the reaction of 1.0 mol of A2 and 1.0 mol of B2? 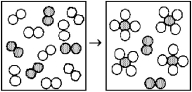
A) 0) 5 mol of product
B) 1) 0 mol of product
C) 2) 0 mol of product
D) 4) 0 mol of product
Correct Answer:

Verified
Correct Answer:
Verified
Q13: A compound responsible for the odor of
Q20: How many anions are there in 2.50
Q25: What is the molar mass of calcium
Q38: 1.00 mole of O<sub>2</sub> contains the same
Q95: <img src="https://d2lvgg3v3hfg70.cloudfront.net/TB4940/.jpg" alt=" -Diethyl ether has
Q96: If the reaction of phosphate ion with
Q146: Which contains the greatest number of chloride
Q147: Which is a formula mass?<br>A)1)0 amu of
Q150: The number of grams in 0.333 mol
Q151: How many milliliters of 0.260 M Na<sub>2</sub>S