Multiple Choice
The following diagram shows a close-up view of the vapor pressure curves for two pure liquids and two different solutions composed of these two liquids.Which curves represent pure liquids and which curves represent the solutions? 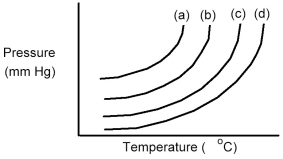
A) Curves (a) and (b) are the pure liquids and curves (c) and (d) are the solutions.
B) Curves (a) and (c) are the pure liquids and curves (b) and (d) are the solutions.
C) Curves (a) and (d) are the pure liquids and curves (b) and (c) are the solutions.
D) Curves (c) and (d) are the pure liquids and curves (a) and (b) are the solutions.
Correct Answer:

Verified
Correct Answer:
Verified
Q54: How many grams of sucrose,C<sub>12</sub>H<sub>22</sub>O<sub>11</sub>,must be added
Q61: At 20°C and 0.28 atm pressure Xenon
Q75: In general,as the temperature increases,the solubility of
Q128: A solution is prepared by dissolving 17.75
Q132: A 0.51 m aqueous solution of an
Q138: What is the mole fraction of ethanol
Q140: Iodine,I<sub>2</sub>(s),is more soluble in dichloromethane,CH<sub>2</sub>Cl<sub>2</sub>(l),than in water
Q140: Calculate the freezing point of a solution
Q141: How many grams of KBr are required
Q191: Assuming that sea water is a 3.5