Multiple Choice
The following plot shows two titration curves,each representing the titration of 50.00 mL of 0.100 M acid with 0.100 M NaOH. 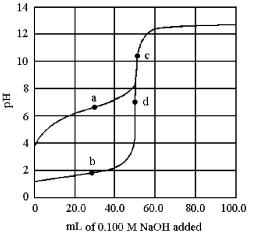
-Which point a-d represents the equivalence point for the titration of a strong acid?
A) point a
B) point b
C) point c
D) point d
Correct Answer:

Verified
Correct Answer:
Verified
Q156: What is the molar solubility of AgCl
Q157: The following pictures represent solutions that contain
Q158: Which is a net ionic equation for
Q159: The following plot shows two titration curves,each
Q160: The following pictures represent solutions of CuS,which
Q162: What is the molar solubility of AgCl
Q163: The following plot shows a titration curve
Q164: What is the [CH<sub>3</sub>CO<sub>2</sub><sup>-</sup>]/[CH<sub>3</sub>CO<sub>2</sub>H] ratio necessary to
Q165: What is the percent dissociation of ascorbic
Q166: What is the pH at the first