Multiple Choice
The following plot shows two titration curves,each representing the titration of 50.00 mL of 0.100 M acid with 0.100 M NaOH. 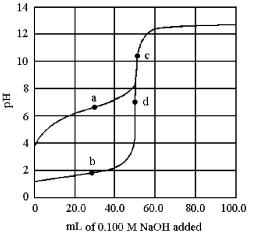
-At which point a-d is the pKa of the acid equal to the pH?
A) point a
B) point b
C) point c
D) point d
Correct Answer:

Verified
Correct Answer:
Verified
Related Questions
Q18: What is the pH of a solution
Q19: What is the equation relating the equilibrium
Q20: The following pictures represent solutions that contain
Q21: What is the magnitude of the change
Q22: Which pair of ions can be separated
Q24: The dissociation equilibrium constants for the protonated
Q25: Which pair of ions can be separated
Q26: At 25°C calcium fluoride has a solubility
Q27: Which of the following mixtures would result
Q28: Which of these neutralization reactions has a