Multiple Choice
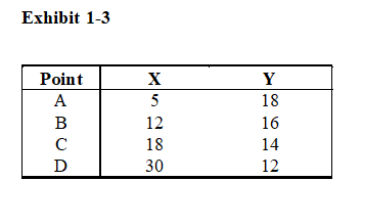
-Refer to Exhibit 1-2.According to the data provided in this table,what is the slope of the line between points C and D,if these data were graphed with X on the horizontal axis and Y on the vertical axis?
A) -3.00
B) -0.33
C) 3.00
D) 0.33
E) none of the above
Correct Answer:

Verified
Correct Answer:
Verified
Q104: The effect of a decrease in interest
Q105: In a two-variable diagram,there is a straight
Q106: If someone gives you a free ticket
Q107: <img src="https://d2lvgg3v3hfg70.cloudfront.net/TB6439/.jpg" alt=" -Refer to Exhibit
Q108: The _ the opportunity cost of doing
Q110: A theory is an abstract representation of
Q111: The synonym economists commonly use for additional
Q112: The coordinates of point A are 30
Q113: In all cases,positive economics deals with<br>A) what
Q114: Economists use the terms resource and input