Multiple Choice
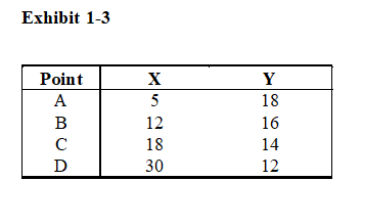
-Refer to Exhibit 1-3.Based on the data provided in this table,if these data were plotted in a two-variable diagram the result would be a ______________ sloping _____________.
A) downward; (nonlinear) curve
B) downward; (straight) line
C) upward; (nonlinear) curve
D) upward; (straight) line
E) none of the above
Correct Answer:

Verified
Correct Answer:
Verified
Q46: Which of the following statements is false?<br>A)
Q47: The primary reason why people cannot have
Q48: In the textbook,economics is defined as the
Q49: Which of the following pairs of variables
Q50: Which of the following issues is most
Q52: <img src="https://d2lvgg3v3hfg70.cloudfront.net/TB6439/.jpg" alt=" -Refer to Exhibit
Q53: What is the most prominent rationing device
Q54: Making a decision at the margin is
Q55: Which of the following is an example
Q56: Which of the following is not one