Multiple Choice
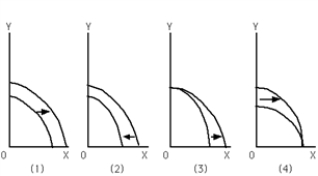
-Refer to Exhibit 2-6.Which graph depicts a technological breakthrough in the production of good X only?
A) (1)
B) (2)
C) (3)
D) (4)
E) none of the above
Correct Answer:

Verified
Correct Answer:
Verified
Q1: <img src="https://d2lvgg3v3hfg70.cloudfront.net/TB6439/.jpg" alt=" -Refer to Exhibit
Q2: A PPF is more likely to be
Q4: Exhibit 2-10<br> <img src="https://d2lvgg3v3hfg70.cloudfront.net/TB6439/.jpg" alt="Exhibit 2-10
Q5: Suppose the economy goes from a point
Q6: <img src="https://d2lvgg3v3hfg70.cloudfront.net/TB6439/.jpg" alt=" -Refer to Exhibit
Q7: Along its production possibilities frontier (PPF)an economy
Q8: Carlos can produce the following combinations of
Q9: The law of increasing opportunity cost results
Q10: Which of the following is an illustration
Q11: Why is the production possibilities frontier (PPF)typically