Multiple Choice
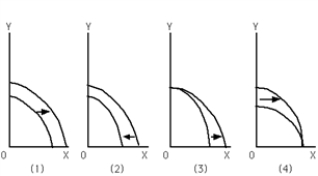
-Refer to Exhibit 2-6.Which graph depicts the result of an increase in the unemployment rate?
A) (1)
B) (2)
C) (3)
D) (4)
E) none of the above
Correct Answer:

Verified
Correct Answer:
Verified
Q118: When an economy is not using all
Q119: Which scenario below most accurately describes the
Q120: Consider two straight-line PPFs.They have the same
Q121: <img src="https://d2lvgg3v3hfg70.cloudfront.net/TB6439/.jpg" alt=" -Refer to Exhibit
Q122: A productive efficient society<br>A) produces at a
Q124: Points that lie inside (or below)the PPF
Q125: The economy was at point A producing
Q126: <img src="https://d2lvgg3v3hfg70.cloudfront.net/TB6439/.jpg" alt=" -Refer to Exhibit
Q127: <img src="https://d2lvgg3v3hfg70.cloudfront.net/TB6439/.jpg" alt=" -Refer to Exhibit
Q128: Suppose the economy goes from a point