Multiple Choice
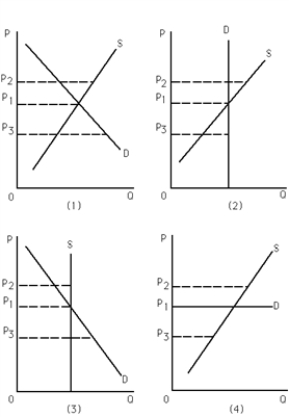
-Refer to Exhibit 3-16.Which of the following is false?
A) Graph (1) : There is a shortage of this good when the price is equal to P3.
B) Graph (2) : As supply increases,equilibrium quantity remains constant.
C) Graph (3) : As demand increases,equilibrium price remains constant.
D) Graph (4) : As supply changes,equilibrium price stays the same.
Correct Answer:

Verified
Correct Answer:
Verified
Q128: Suppose that for a given good demand
Q129: Which of the following statements represents a
Q130: Which of the following statements is true?<br>A)
Q131: If the workers of a firm successfully
Q132: <img src="https://d2lvgg3v3hfg70.cloudfront.net/TB6439/.jpg" alt=" -Refer to Exhibit
Q134: <img src="https://d2lvgg3v3hfg70.cloudfront.net/TB6439/.jpg" alt=" -Refer to Exhibit
Q135: As the price of good X rises
Q136: If the quantity demanded of good X
Q137: In the market for good X there
Q138: <img src="https://d2lvgg3v3hfg70.cloudfront.net/TB6439/.jpg" alt=" -Refer to Exhibit