Multiple Choice
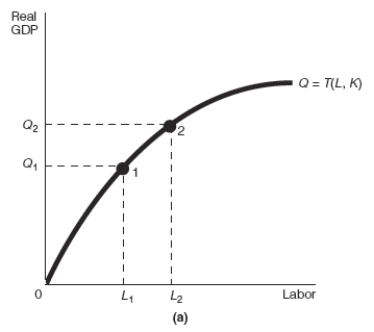
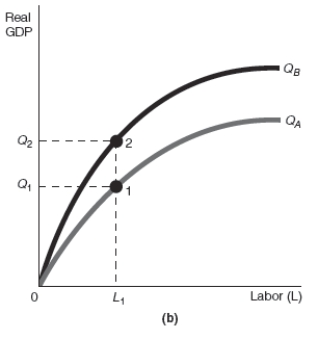
-Refer to Exhibit 17-2.Assume that the starting point is always point 1.Which of the production function graphs shown,(a) or (b) ,represents an increase in the quantity of labor,and which represents an increase in the quantity of capital,respectively?
A) (a) ; (a)
B) (b) ; (a)
C) (a) ; (b)
D) (b) ; (b)
Correct Answer:

Verified
Correct Answer:
Verified
Q77: Production Function<br>Real GDP = T (L,K),such that
Q78: Technological advances make it possible to<br>A) produce
Q79: According to new growth theory,technological advances can
Q80: "Absolute real economic growth" is defined as
Q81: Using the production function Real GDP =
Q81: Using the production function Real GDP =
Q83: Production functions used in economic growth theory
Q84: Lower interest rates cause a(n)_in capital utilization,which
Q85: Applying the concept of a production function
Q86: <img src="https://d2lvgg3v3hfg70.cloudfront.net/TB6439/.jpg" alt=" -Refer