Multiple Choice
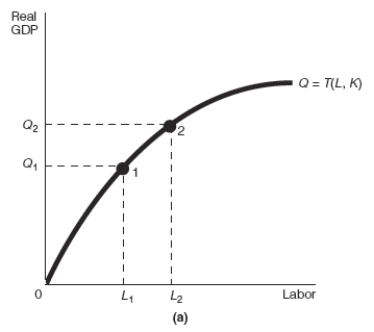
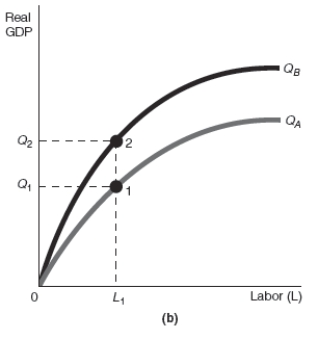
-Refer to Exhibit 17-2.Assume that the starting point is always point 1.Which of the production function graphs shown,(a) or (b) ,represents an increase in the quantity of labor,and which represents an increase in the technology coefficient,respectively?
A) (a) ; (b)
B) (b) ; (a)
C) (a) ; (a)
D) (b) ; (b)
Correct Answer:

Verified
Correct Answer:
Verified
Q92: Technology is defined as "the humanly devised
Q93: Production Function<br>Real GDP = T (L,K),such that
Q94: In contrast to neoclassical growth theory,new growth
Q95: In the production function Real GDP =
Q96: The relation between technology and the quantity
Q98: An economy growing at a steady rate
Q99: In the production function Real GDP =
Q100: Examples of physical capital include _.Examples of
Q101: The range of laws,rules,and regulations that define
Q102: If a country's economic growth rate is