Multiple Choice
based on the following scenarios. 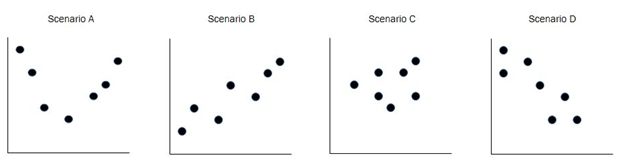
-Which graph depicts a negative correlation?
A) Scenario A
B) Scenario B
C) Scenario C
D) Scenario D
Correct Answer:

Verified
Correct Answer:
Verified
Related Questions
Q54: Making a scatter diagram before figuring the
Q55: A cognitive psychologist studying the structure of
Q56: People who observe a minority-group person doing
Q57: What is the direction of causality when
Q58: A health psychologist conducted a study of
Q60: The items below (# 62 - 64)are
Q61: How does Ralph Rosnow and Robert Rosenthal's
Q62: A graph that shows the pattern of
Q63: Low reliability of the variables reduces the
Q64: The situation in which you figure a