Multiple Choice
Consider the following chart.Which of the following statements is most correct? 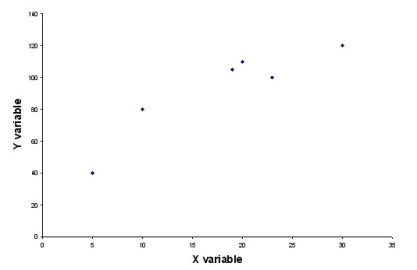
A) There is a negative linear relationship between the two variables.
B) There is a positive linear relationship between the two variables.
C) There is a perfect linear relationship between the two variables.
D) There is no apparent relationship between the two variables.
Correct Answer:

Verified
Correct Answer:
Verified
Q13: A stem and leaf diagram is more
Q47: In a report describing the number of
Q60: One of the differences between a stem
Q68: The Fitness Center manager has collected data
Q83: A line chart is most appropriate for:<br>A)
Q84: A university recently collected data for a
Q87: If a scatter diagram shows points that
Q92: In creating a frequency distribution for numerical
Q127: There is no difference between cumulative frequency
Q135: One of the advantages that a stem