Multiple Choice
Consider the following chart.Which of the following statements is most correct? 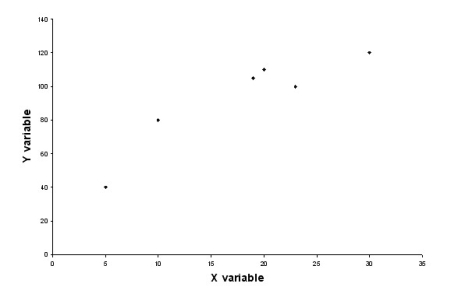
A) The values for the dependent variable are determined by the values for the independent variable.
B) The values in a scatter plot should be connected by a straight line.
C) The variable on the horizontal axis should be the independent variable.
D) A scatter plot like this one shows the trend in the data over time.
Correct Answer:

Verified
Correct Answer:
Verified
Q4: One characteristic of a bar chart is:<br>A)
Q32: A common rule of thumb for determining
Q42: Explain why a relative frequency histogram is
Q51: A scatter diagram can show that the
Q80: In analyzing a single quantitative variable, you
Q81: Which of the following can NOT be
Q81: A study was recently done in which
Q85: A scatter diagram can show whether a
Q114: An ogive is a graph of a
Q122: A bar chart possesses which of the