Multiple Choice
The following data reflect the number of customers who test drove new cars each day for a sample of 20 days at the Redfield Ford Dealership. 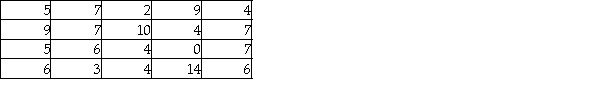 Given these data,what is the interquartile range?
A) 3
B) 7
C) 4
D) 14
Correct Answer:

Verified
Correct Answer:
Verified
Related Questions
Q17: Consider a situation involving two populations where
Q66: Incomes in a particular market area are
Q84: The owner of a local gasoline station
Q90: A distribution is said to be symmetric
Q95: It is possible for a set of
Q108: The distribution of bankcard balances for customers
Q118: In drawing a box and whisker plot
Q120: Consider the following sample data: <img src="https://d2lvgg3v3hfg70.cloudfront.net/TB3933/.jpg"
Q122: Based on the empirical rule we can
Q125: The Good-Guys Car Dealership has tracked the