Multiple Choice
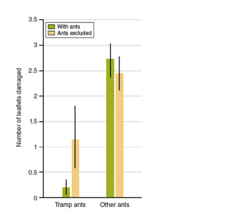
-In the figure,which represents data from the "ant plant" experiments in Investigating Life 22.5,what was the dependent variable?
A) the presence of tramp ants
B) the number of leaflets that were damaged
C) the amount of nectar consumed
D) the amount of fruit produced
E) the presence of other ants
Correct Answer:

Verified
Correct Answer:
Verified
Q36: The shoot of a plant is the
Q53: Which of the following is not a
Q54: The stalk-like support for a leaf is
Q55: A tomato,squash,or bean would be considered a
Q56: In lab,you are shown a freshly cut
Q58: The vegetative parts of plants are those
Q59: The tissue that regrows a leaf from
Q60: Home gardeners who grow tomatoes are often
Q61: What was the researcher's conclusion in the
Q62: Vegetative edible plant parts include roots,fruits,stems,and tubers.