Multiple Choice
This figure shows graphed medical research results from a study on a new vaccine. The research was done in an effort to determine if a new vaccine would be effective at preventing potentially dangerous rotavirus infections in infants. Green data bars represent occurrence of infant cases that had normal rotavirus strains that aren't critically dangerous. Blue data bars represent occurrence of infant cases that had more dangerous rotavirus strains that can hospitalize or lead to fatality of infants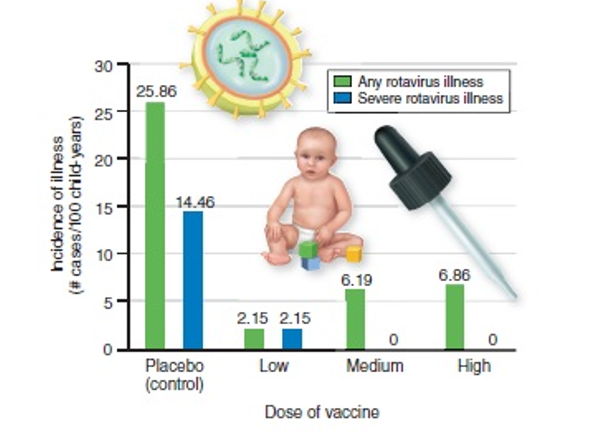
-In the graph,interpret the data that are shown regarding the response of a large number of infants to vaccination from dangerous rotavirus infection.Which of the hypotheses is NOT supported by these data results?
A) The new vaccine is ineffective in protecting infants from any rotavirus infection.
B) The high dose of the new vaccine does not offer any stronger protection from any rotavirus infection than the medium dose.
C) The low dose of the vaccine reduces incidence of illness from any rotavirus in general, and also severe rotavirus.
D) Hypotheses about the vaccine doses can't be evaluated, because the placebo group is biased, with high incidence of illness in those infants.
E) Medium and high doses of the vaccine are more effective at reducing severe rotavirus illnesses than reducing any rotavirus.
Correct Answer:

Verified
Correct Answer:
Verified
Q18: A golfer wants a new set of
Q19: Researchers can readily extract DNA from one
Q20: Organisms that make their own nutrients by
Q21: What did Charles Darwin propose after observing
Q22: In an experiment designed to determine if
Q24: The smallest scale of biological organization is
Q25: In an experiment,which of the following is
Q26: A theory differs from a hypothesis in
Q27: A structure,such as a flower in plants,or
Q28: If your physician determines that you are