Multiple Choice
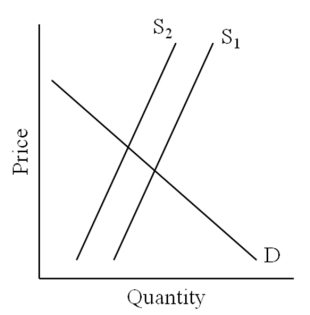
-A shift in the above graph from S1 to S2 may represent
A) a tax increase.
B) a tax decrease.
C) the imposition of a price ceiling.
D) the imposition of a price floor.
Correct Answer:

Verified
Correct Answer:
Verified
Related Questions
Q37: The imposition of a tax on a
Q38: Which statement is true?<br>A)A vertical demand curve
Q39: If demand is elastic and price is
Q40: If demand is more elastic than supply,the
Q41: If demand for a service is very
Q43: If price were lowered from $11 to
Q44: If income elasticity for a good or
Q45: Which of the following statements best represents
Q46: Advertisers try to _ the demand for
Q47: A perfectly inelastic supply curve is<br>A)horizontal.<br>B)vertical.<br>C)positively sloped.<br>D)negatively