Multiple Choice
 Refer to the figures above.Suppose the graphs represent the demand for use of a local golf course for which there is no significant competition (it has a local monopoly) .P denotes the price of a round of golf and Q is the quantity of rounds sold each day.If the left graph represents the demand during weekdays and the right graph the weekend demand,how much economic profit will this profit-maximizing golf course earn over the course of a full seven-day week?
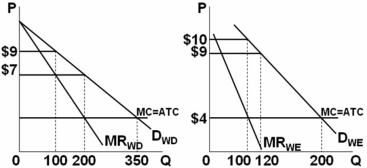
A) $4200
B) $3700
C) $3400
D) $2700
The monopolist should set MC = MR in both markets.That means the weekday output should be 200 with a price of $7 and the weekend output should be 100 with a price of $10.This means 5 days of 100 rounds each and 200 weekend rounds for a total of 1200.Average total cost is $4 per round,so weekday profits are $3 * 200 * 5 = $3000 and weekend profits are $6 * 200 = $1200.Total profits are $4200.
Correct Answer:

Verified
Correct Answer:
Verified
Q31: <img src="https://d2lvgg3v3hfg70.cloudfront.net/TB4893/.jpg" alt=" On the graph
Q32: The classic example of a private,unregulated monopoly
Q33: In many large U.S.cities,taxicabs operate as near
Q34: Equilibrium for the monopolist occurs where P
Q35: If a pure monopolist can engage in
Q38: Laws and government actions designed to prevent
Q39: In the short run,a monopolist's profits:<br>A) may
Q40: <img src="https://d2lvgg3v3hfg70.cloudfront.net/TB4893/.jpg" alt=" Refer to the
Q41: Natural monopolies result from:<br>A) patents.<br>B) copyrights.<br>C) control
Q147: A nondiscriminating monopolist will find that marginal