Multiple Choice
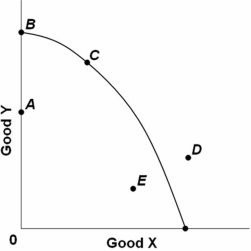 The graph above shows the production possibilities curve for an economy producing two goods,X and Y.Which of the points on the graph indicate unemployed resources?
A) D only
B) E only
C) E and A only
D) B and C only
Correct Answer:

Verified
Correct Answer:
Verified
Q21: Which situation would most likely cause a
Q22: If the marginal benefits of the output
Q23: <img src="https://d2lvgg3v3hfg70.cloudfront.net/TB4893/.jpg" alt=" Refer to the
Q24: An "aggregate":<br>A) treats a collection of specific
Q25: If a production possibilities boundary is a
Q27: How is the economic perspective reflected in
Q28: As a consequence of the condition of
Q29: The following economy produces two products. <img
Q30: The term "scarcity" in economics can refer
Q31: The overallocation of resources by society to