Essay
You are given the following probability distribution for XYZ common stock's returns during the next year,which are assumed to be normally distributed.Show all work below,and complete the following:
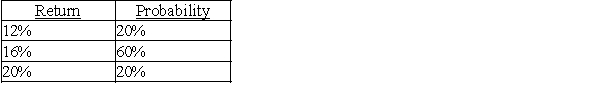 a.Calculate the standard deviation of the returns,and round to the nearest one-half percent.
b.Draw a graphical representation of XYZ's normal distribution below (ye old bell-shaped curve).LABEL THE AXES OF THE GRAPH OR THE FOLLOWING RESULTS WILL BE MEANINGLESS.Using your result in part A for the standard deviation (rounded to the nearest one-half percent)explain and indicate on the graph,the probability that XYZ will return more than 13.5%,assuming a normal distribution.
Correct Answer:

Verified
GRAPH:
a.Exp.Return = (.12 × .2)+ (.16 ×...View Answer
Unlock this answer now
Get Access to more Verified Answers free of charge
Correct Answer:
Verified
a.Exp.Return = (.12 × .2)+ (.16 ×...
View Answer
Unlock this answer now
Get Access to more Verified Answers free of charge
Q33: You are thinking of adding one of
Q34: Billings,Inc.common stock has a beta of 1.2.If
Q36: You hold a portfolio with the following
Q39: Assume that you have $200,000 invested in
Q41: Which of the following measures the average
Q42: Joe purchased 800 shares of Robotics Stock
Q43: You are considering an investment in First
Q59: The expected return for the market portfolio
Q91: Assume that you have $100,000 invested in
Q116: The S&P 500 index must be used