Essay
A Procter and Gamble factory process fills boxes with detergent. Construct an appropriate set of control charts to monitor the process. Historical data for fill weight (in ounces) of eight samples is presented below. A sample size of six was used. 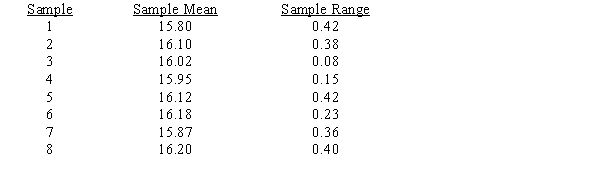
a.Compute the limits for both an R-chart and x-bar chart. Compare the sample results to the limits of the charts.
b.Briefly explain what the quality control charts tell you. What actions, if any, would you take?
Correct Answer:

Verified
a.UCLR = (2.004)(.305) = 0.611
LCLR = (0)(...View Answer
Unlock this answer now
Get Access to more Verified Answers free of charge
Correct Answer:
Verified
LCLR = (0)(...
View Answer
Unlock this answer now
Get Access to more Verified Answers free of charge
Q5: p-charts<br>A)Are used for the fraction of non-conforming
Q10: A bottling machine fills soft drink bottles
Q23: Historically, the average proportion of defective bars
Q24: A bottling process sometimes results in overfills
Q35: c-charts<br>A)Are used for the fraction of non-conforming
Q72: Flaws are counted on a standard steel
Q73: In the 1:10:100 Rule, which of the
Q74: To monitor the fraction of printed circuit
Q78: Find the control limits for a c-chart
Q99: A company is measuring the time it