Multiple Choice
Below is a graph illustrating rice and flax production in the countries of Cardassia and Bajor.
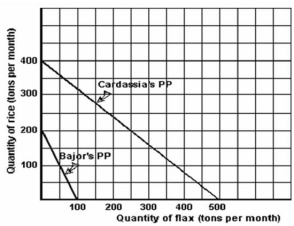
-Refer to the graph above to answer this question.What is the opportunity cost of 100 tons of rice in Cardassia?
A) 80 tons of flax.
B) 100 tons of flax.
C) 125 tons of flax.
D) 200 tons of flax.
E) 500 tons of flax.
Correct Answer:

Verified
Correct Answer:
Verified
Q90: Table 13.14 shows the output of kumquats
Q91: Table 13.1 shows the production possibilities curves
Q92: Below is the productivity per worker (kilos
Q93: Table 13.14 shows the output of kumquats
Q94: <img src="https://d2lvgg3v3hfg70.cloudfront.net/TB5692/.jpg" alt=" -Refer to above
Q96: What are the two largest categories of
Q97: What term describes the average price of
Q98: All of the following,except one,are reasons why
Q99: Suppose that the cost of producing 1
Q100: Table 13.14 shows the output of kumquats