Multiple Choice
The following graph shows the average and marginal revenue curves for a monopolist:
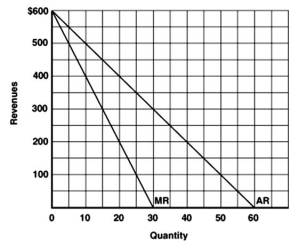
-Refer to the graph above to answer this question.What is the monopolist's maximum revenue?
A) $30.
B) $60.
C) $300.
D) $600.
E) $9,000.
Correct Answer:

Verified
Correct Answer:
Verified
Q12: The following graph gives cost and revenue
Q13: Draw a linear demand curve,marginal revenue curve,marginal
Q14: The following graph gives cost and revenue
Q15: A monopolist would never produce in the
Q16: Using a graph,contrast monopoly and perfect competition
Q19: All,except one,of the following statements regarding the
Q20: The following graph gives cost and revenue
Q21: <img src="https://d2lvgg3v3hfg70.cloudfront.net/TB5692/.jpg" alt=" -Refer to the
Q22: Why would a lump-sum profit tax have
Q234: What is a natural monopoly?